This is the spring update on the latest Second Life grid statistics looking back at the past three months of 2022. My last stats blog post was made on 2nd January 2022 where I reported that 2021 was a good strong year for Second Life growth. Interest overall was up for residents buying their own private estates around the grid and Linden Owned regions showed positive growth trends through 2021.
As we approach the start of April 2022 it’s time to look at what’s been happening over the past three months in terms of regions, daily concurrency, registered signups and the Second Life website traffic stats. My next grid statistics blog posts will be published at the end of June, September and December 2022. I will blog if any big changes do happen of course during the year.
Second Life Regions
Since early January 2022 the Second Life grid has showed steady positive growth (+172 regions). This is really good news to see more regions being added on the Second Life grid and I really hope this positive regions trend continues for the rest of the year. There might be something in the upcoming Premium Plus package where interest for new regions will go up even further or if the lab announce any land price reductions.
Most of the growth during the past three months has again come from Linden Owned regions where most of which have been added to the Bellisseria continent in Second Life. There is at least another few Linden Home themes still yet to be announced and be released on the grid. I would expect the Linden Owned regions will triple over the next 10 months or so. It’s going to be close to 28, 000 by 2023 hopefully if more growth happens.
Main Grid Size as of 27th March 2022 – (vs 2nd January 2022)
- Total: 27, 403 – (up from 27, 231)
- Private Estates: 18, 339 – (up from 18, 332)
- Linden Owned: 9, 064 – (up from 8, 909)
- Total Area: 1795.88KM – (up from 1784.61KM)
Second Life Daily User Concurrency

At the end of December 2021 I reported that the Second Life user concurrency remained stable through 2021 which was good to see happening. The highest peak for 2021 was 57, 746 on 23rd March 2021 and since it’s been averaging around 51, 000 to 55, 000 since start of 2022.
March 2022 Daily Concurrency Levels
- Maximum Daily Concurrency: 48, 000 to 53, 000 (average)
- Median Daily Concurrency: 38, 000 to 42, 000 (average)
- Minimum Daily Concurrency: 28, 000 to 33, 000 (average)
The green line above marks the start of 2022 for reference and as you can see there has already been some noticeable drops in daily user concurrency on 25th January, 8th February and 15th February. It’s not really gone above the 56, 000 mark (at max) so far in 2022 but hopefully there will be high peaks again soon.
We will have to see if the trends continue like this or get better when I published my next stats blog post in June 2022.
Second Life Registered Signups
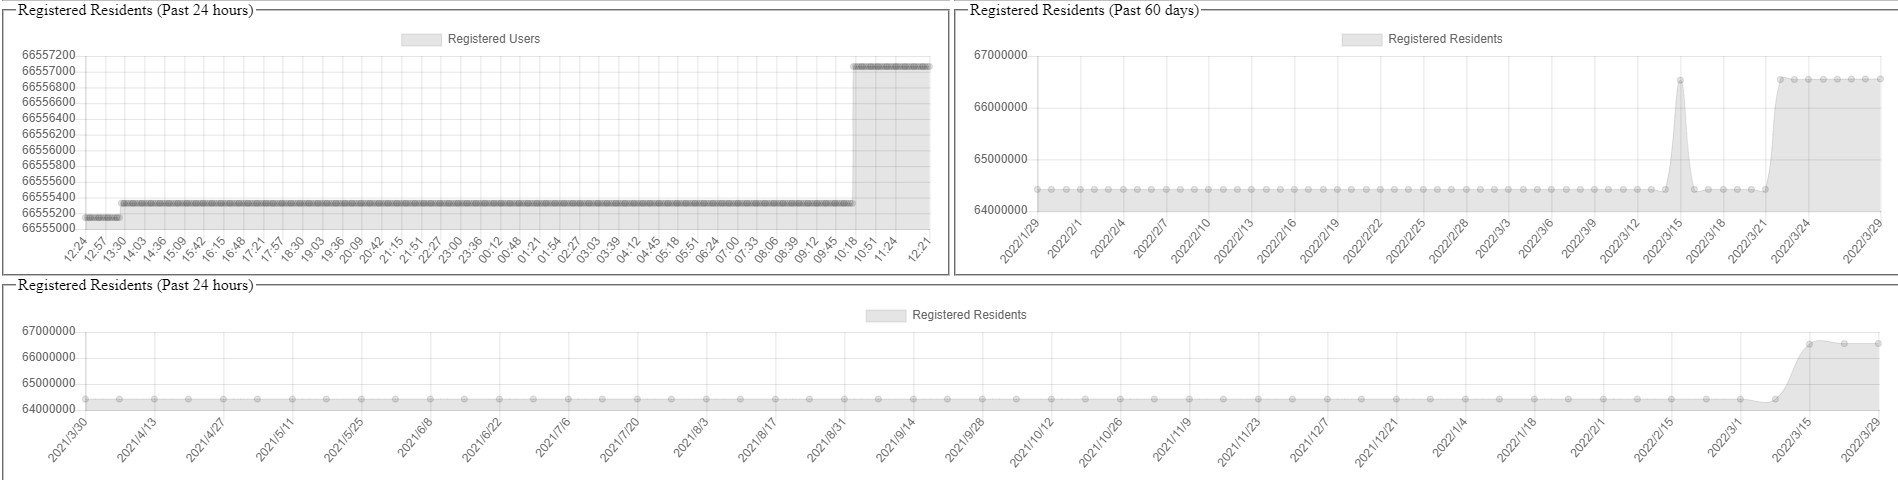
On 29th March 2022 the SL Stats graphs showed that there have been 66, 557, 066 registered Second Life signups since the launch back in 2003. Data resumed from 15th March 2022 and it’s not clear if these are correct figures or if there has been a mix up somewhere. Back at SL18B the official figure’s from the lab was 70+ million registered accounts as of mid June 2021.
Second Life Website Traffic
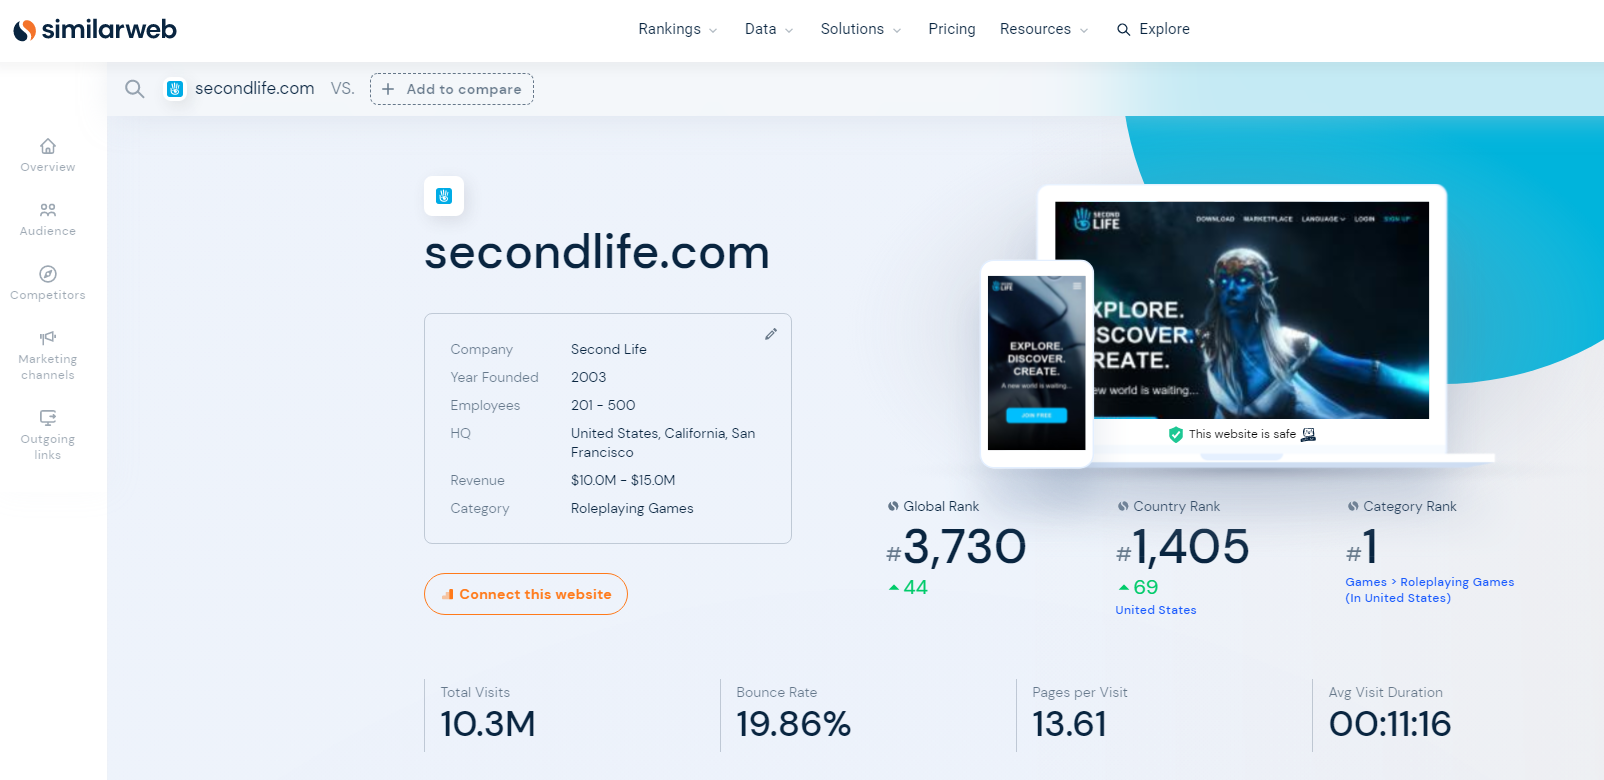
Here are the latest Second Life website traffic stats for the past three months via similarweb which tracks secondlife.com traffic. These are pretty interesting statistics when you scroll down the page from the global rank, average visit duration, pages per visit, bounce rate and more.
- Employees: 201 – 500
- Revenue: $10.0M – $15.0M
- Global Rank: 3, 730 / Country Rank: 1, 405 (US)
Total Visits Last 3 Months – (it’s a month behind)
- December 2021: 12.1 million
- January 2022: 11.4 million
- February 2022: 10.3 million
- March 2022: Should be published at some point in April 2022

Top Countries – Based on geographic location of a site’s core audience over the past month. Here are the countries sending the most traffic to secondlife.com in order.
- United Stats: 48.70%
- United Kingdom: 5.55%
- Germany: 4.58%
- Brazil: 4.32%
- Canada: 4.30%
- Others: 32.55%
Marketing Channels Overview – Digital marketing channels driving traffic to secondlife.com
- Direct: 72.81%
- Search: 16.43%
- Social: 7.19%
- Referrals: 1.94%
- Mail: 1.60%
- Display: 0.03%
Keyword Search Traffic – List of top paid and organic keywords driving traffic to secondlife.com
- Organic: 99.97% / Paid: 0.03%
- Total Keywords: 16.8k
- secondlife – 14.43%
- sl marketplace – 3.69%
- secondlife – 3.28%
Social Network Distribution – Top social media networks directing traffic to secondlife.com
- Facebook: 42.46%
- YouTube: 24.59%
- Pinterest: 10.30%
- Twitter: 5.71%
- Flickr: 4.81%
- Others: 12.14%
I hope these grid and website statistics are useful for everybody. Feel free to blog about it and spread the word. Thanks.

One thought on “Second Life Grid Statistics – March Update 2022”