My last post on Second Life statistics was published in early April 2013 during the spring update. Check out the updated summer update on Second Life statistics since April 2013. I would love to know what you think in comments! 🙂
Total Regions
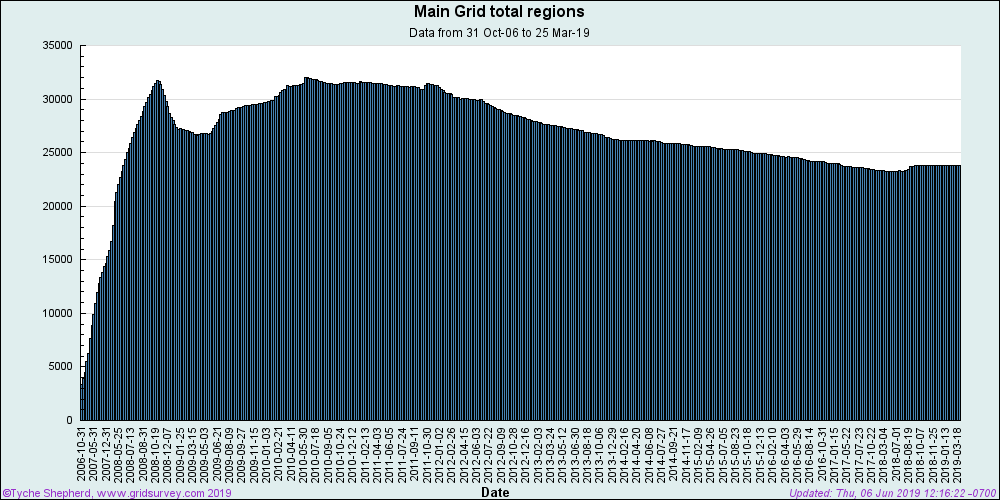
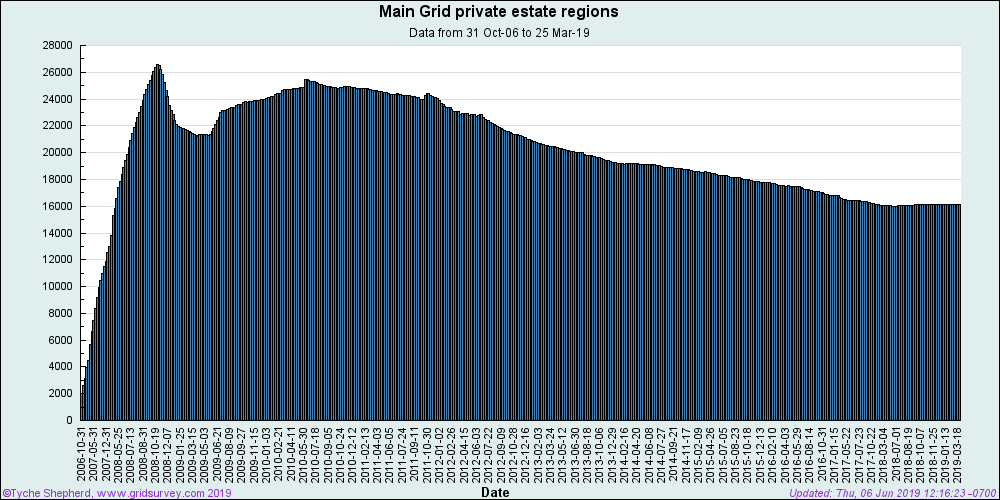
Since early April 2013 it appears the total amount of regions in Second Life is still slowly declining and private estates will soon be under the 20, 000 regions mark if rates continue. Somehow there needs to be more interest in Second Life in the coming months and hopefully with new improvements coming to Second Life things may pick up again before the end of the year.
According to Tyche Shepherd on 30th June 2013 the grid is down by 959 regions since 30th December 2012 which is a 4.6% drop. This time last year the grid was down by 1, 230 regions with a 5.2 decline rate.
Graph shows the weekly net change in number of regions since 30th December 2012

Hypergrid Business reported in mid June 2013 that Opensim grids had passed Second Life in land area which was predicted to happen one day. This suggests people are finding OpenSim grids better than Second Life in many ways and find OpenSim grids more interesting than ever before. Many are predicting we won’t see good SL growth in regions again until the economies of the world fully recover sometime before 2020.
On 5th December 2012
- Total Main Grid regions: 28, 290
- Total Area (km²): 1854.01
- Private Estates: 21, 200
- Linden Owned: 7, 090
On 2nd April 2013:
- Total Main Grid regions: 27, 570
- Total Area (km²): 1806.83
- Private Estates: 20, 482
- Linden owned: 7, 088
As of 2nd July 2013:
- Total Main Grid regions: 27, 144
- Total Area (km²): 1778.91
- Private Estates: 20, 033
- Linden owned: 7, 111
Graph showing main grid total regions from 31st October 2008 to 30th June 2013
Graph showing private estate regions between 31st October 2008 to 30th June 2013
SL daily concurrency levels
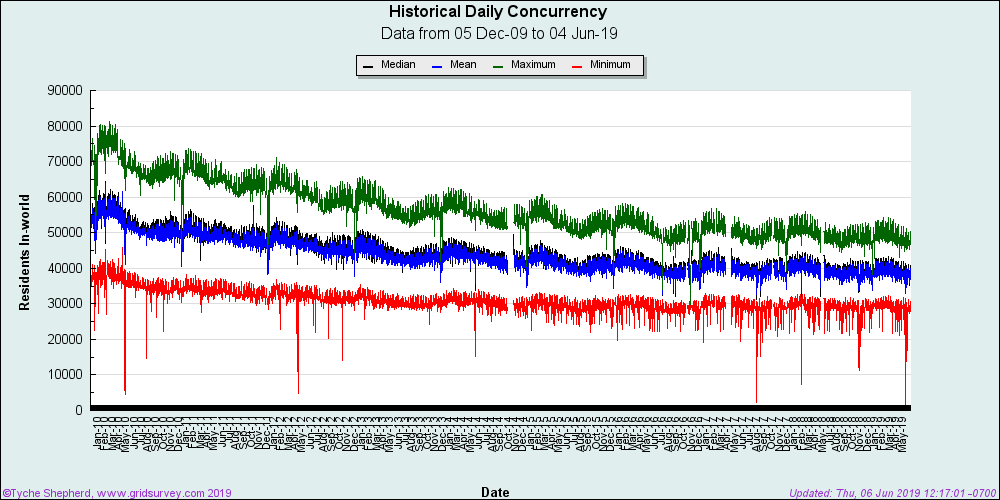
- Maximum Daily Concurrency seems to be reaching 56, 000 to 58, 000 at peak times during the last 3 months. Below the 60, 000 mark its staying at the moment.
- Minimum Daily Concurrency seems to holding around the 29, 000 to 32, 000 mark during the last 3 months.
- Median Daily Concurrency seems to be around 41, 000 to 45, 000 during the last 3 months.
Graph showing the historical daily concurrency from 5th December 2009 to 30th June 2013. On average the SL daily concurrency is now between 29, 000 to 58, 000 at peak times.
SL sign ups
At the start of 2013 sign ups were reaching 16, 000+ and then there was a rather huge surge in signups during April 2013 to 17, 000 sign ups every day. According to Dwell On It signup graphs there is around 12, 000 to 13, 000 new sign ups every day for Second Life at the moment.
My next SL statistics blog post will be in the first week October 2013 for the winter update.

I have heard it said previously that practically all new signups do not return. This would be an interesting metric to track.
LikeLike
Hmm, surely many will return unless they are all bots signing up?
LikeLike
How many of these sign-up are spambots? How many are griefers’ throwaway accounts? How many are more and more sockpuppets used by forum and feed trolls?
LikeLike
It’s hard to tell without proof.
LikeLike
Some actually brag about their numerous sockpuppets… And posting style is good evidence.
LikeLike
That is for sure not accurate,, watching a lot of new users later and not Alts for sure!
LikeLike
I think we need evidence really.
LikeLike
There no way to check if an avatar is an alt or no. One can registers alt with different emails address than the main one, and checking with the IP doesn’t work too, since many people can share the same. Not talking also about the fact that if you don’t know the person behind an avatar, how can you tell who she is ? One clue could perhaps be the state of designers business in Second Life, since a person won’t spend more money if she has many alts than when she have only one avatar ?
LikeLike
I think it very telling that with the concurrency graph showing a consistent decline and the apparent high level of sign-up’s doing nothing to arrest the trend then something has got to be seriously wrong with Second Life. And, for all the Lab’s attempts to improve the system it’s doing little, if anything, to stop it.
At the same time the dream of a free Metaverse continues to be realized with ever greater stability in the platform software and growing numbers of small private standalone worlds people can set up at very low cost compared with Linden Lab’s excessive charges. What’s more they can connect via hypergrid and we are seeing considerable growth across the whole Metaverse from commercial grids to education, the arts and community. Every month more little grids set up with a few regions and very soon the owners discover other sections of the community welcoming them and ready to help them with technical advice, free and paid for properly licensed content and much more. The Opensim Virtual community in Google Plus is a good place to start one’s adventure into the free Metaverse…
https://plus.google.com/u/0/communities/116284417302234467612
LikeLike
Thanks Talla for your views on SL concurrency and thanks for the link. 🙂
LikeLike
I echo Talla – 10,000 daily signups seem meaningless since concurrency slowly declines. that 10K has been the number LL has used for years
i remember when the all time record of 88,000 was reached – when i started inSL, it was only about 35K in the evenings and it kept growing and growing – i thought SL was the most awesome thing ever. i spent about $50,000 USD all told (not all a loss, some was offset with tiers) but my account paid LL about $50K all total
who would not love customers like hat? short answer: LL could care less and what a shame
more than global economy needs to change – SL is no longer the promise of anything possible and there are alternatives out there that can do more than SL can
OpenSim, for me, is far better since i can have 7 year olds in it learning science – not possible inSL . . .
LikeLike
Thank you for the link
LikeLike
Reblogged this on The Lionheart Times.
LikeLike